Dashboard
Purpose
The Dashboard is your control center for AI health on this TYPO3 instance. Open it daily for a quick status check.
Path: AI Foundation > Dashboard
Follow this interactive walkthrough, then continue with the details below.
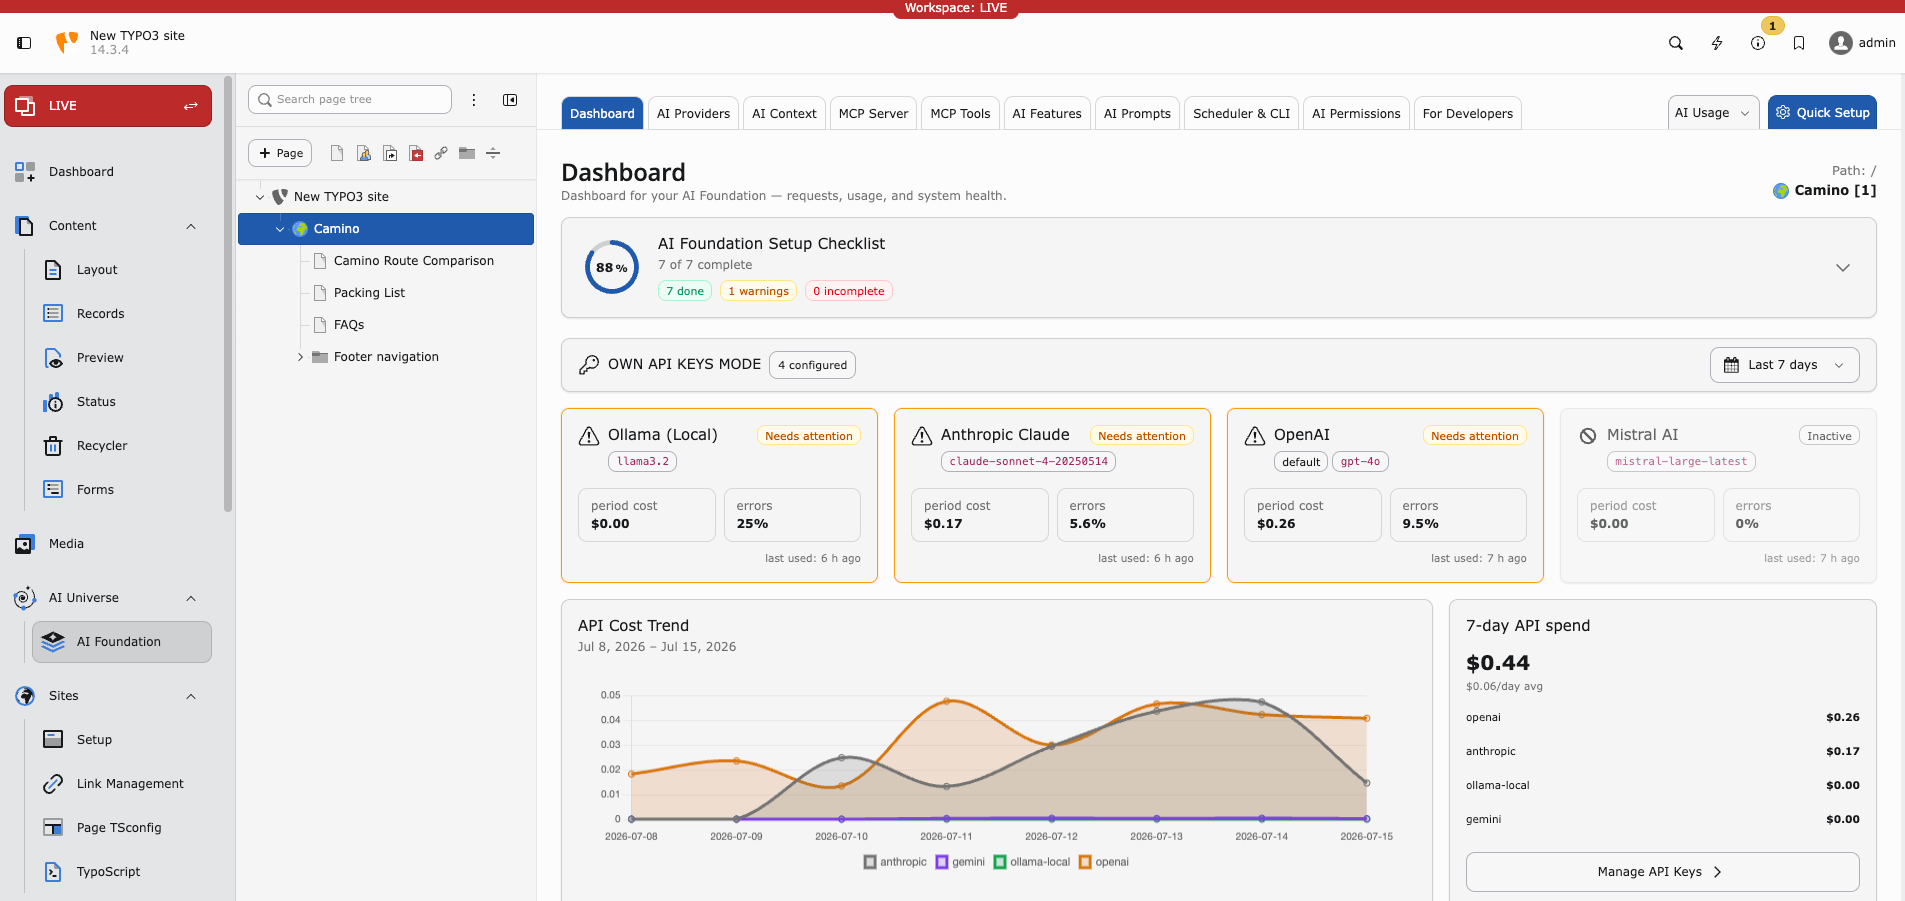
Dashboard overview — setup progress, provider health, and API cost trend.
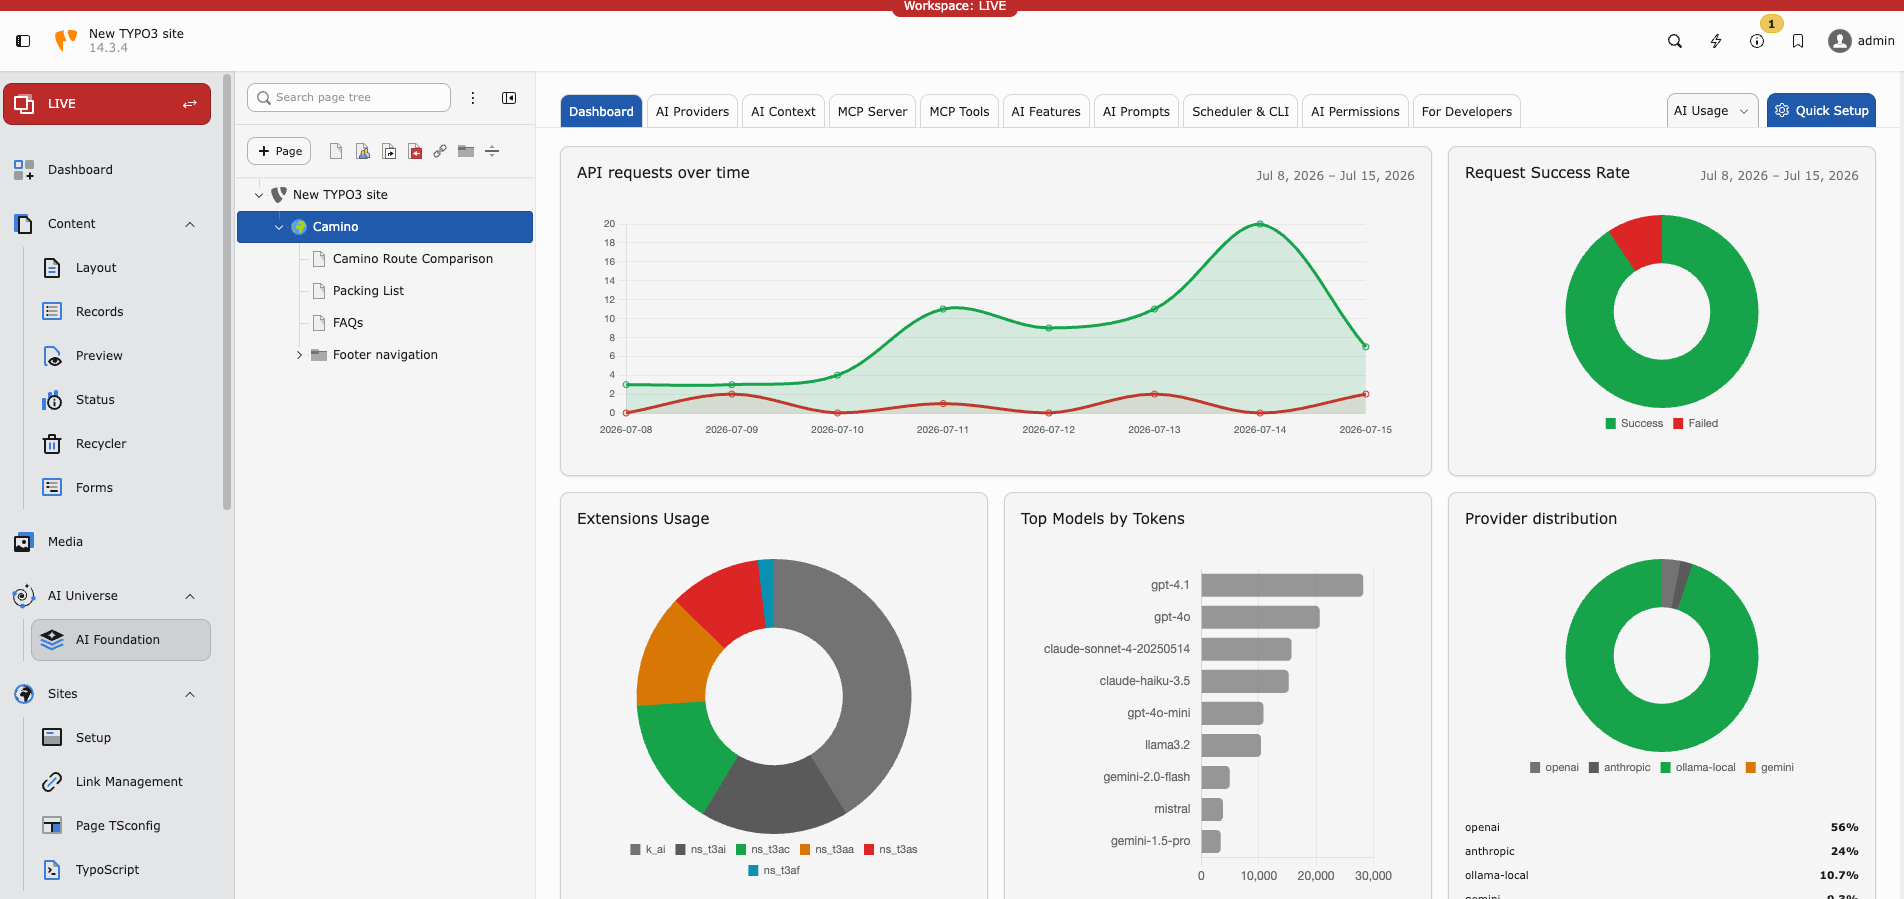
Usage analytics — requests over time, success rate, top models, and provider distribution.
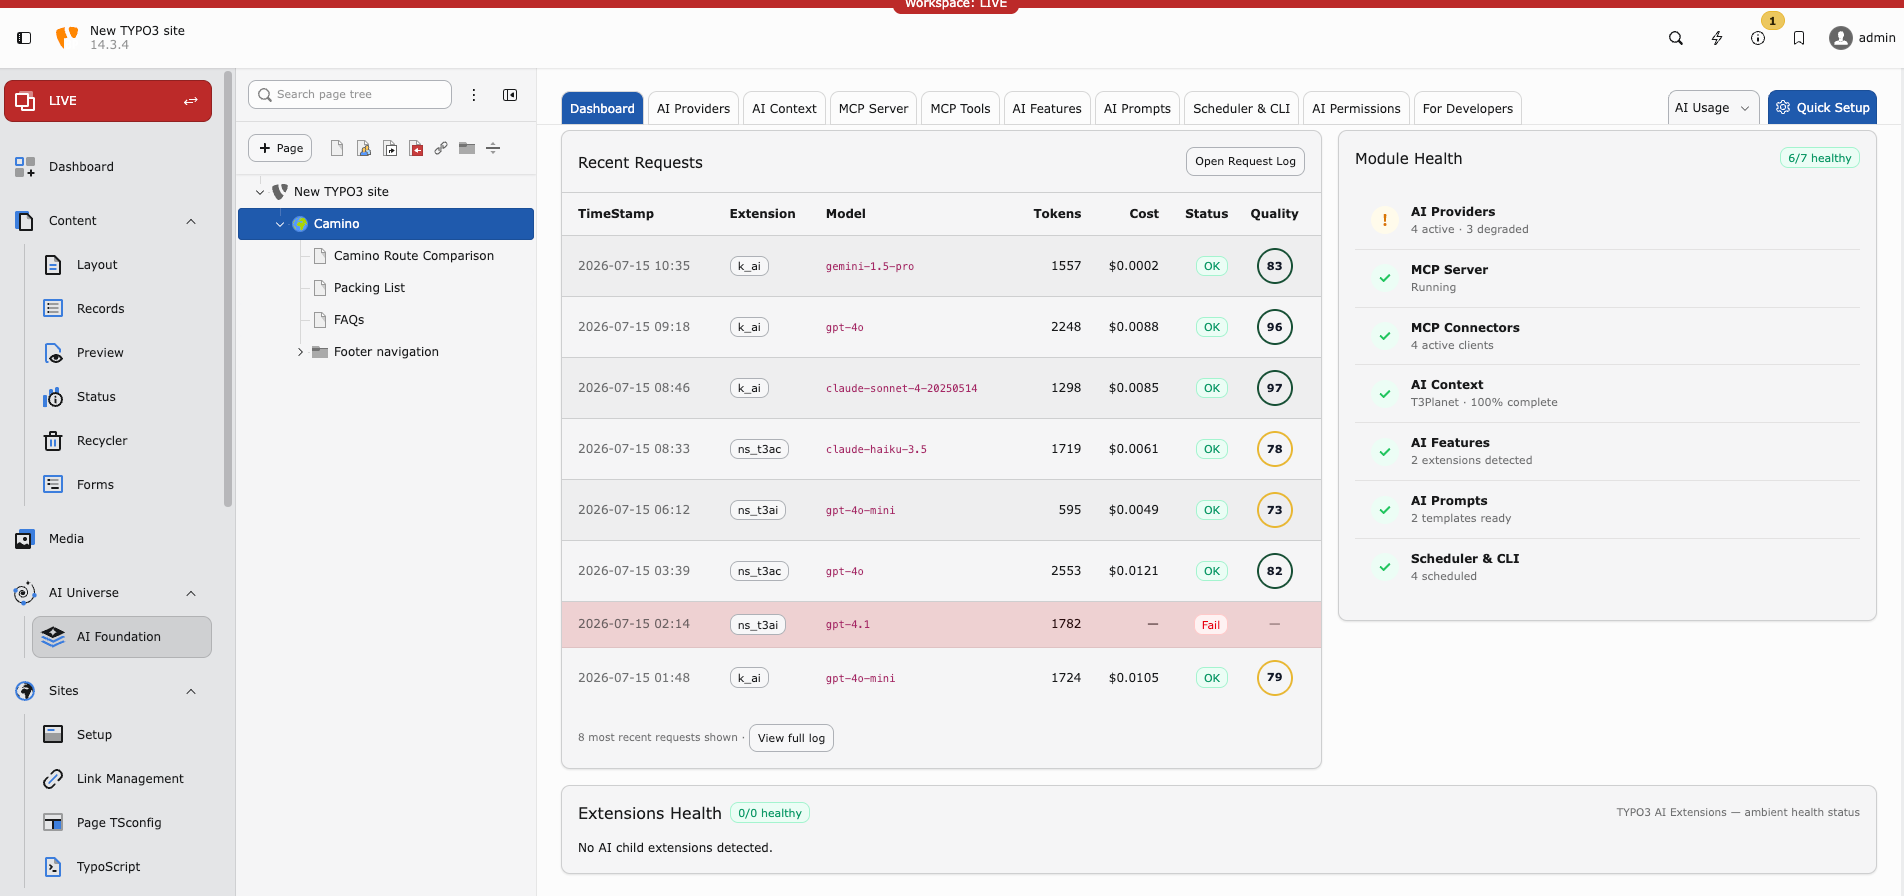
Recent requests and module health — request log, costs, and subsystem status.
What the dashboard shows
Provider status — Connected, failed, or not tested
Default provider — Active model name
Recent usage — Last requests and token count
Quick actions — Links to AI Providers, MCP Server, and related modules
Daily admin routine (2 minutes)
Open Dashboard
Confirm provider status is green
Skim AI Logs if usage looks unusual — see AI Usage & Logs
Status meanings
Green — Provider OK. No action needed.
Yellow — Not tested recently. Run a Test connection in AI Providers.
Red — Connection failed. Check API key, model ID, and outbound HTTPS.
Quick links from the dashboard
AI Providers → AI Providers
MCP Server → MCP Server
View Logs → AI Usage & Logs
Tips
Set one clear default provider — avoids confusion for editors
Test providers after every key rotation
Review usage weekly for cost control
When the dashboard shows red
Open AI Providers → run Test connection
Check vendor status page (OpenAI, Anthropic, etc.)
Verify firewall allows outbound HTTPS
Check AI Logs for the exact error message
See Known Problems if the issue persists